Driven by Data: Analytics Dashboards for Fantom
In the data-driven world of blockchain, comprehending the vast amount of information available is a challenging task even for the sharpest minds. Fantom alone sees hundreds of thousands of transactions flow through it daily, and analyzing all of these solely through a block explorer is a time-consuming and ineffective process.
Analytics dashboards provide a solution by streamlining blockchain data, allowing users to track, analyze, and visualize transactions. Their aim is to provide insights into the flow of on-chain assets.
Let’s explore some of the analytics dashboards on which Fantom transactions can be analyzed.
Dune
“Dune is a web-based platform that allows you to query public blockchain data and aggregate it into beautiful dashboards.”
Rather than focusing on offering its own dashboards, Dune is a platform on which anyone can create analytics dashboards by querying blockchain data and presenting it in human-readable formats.
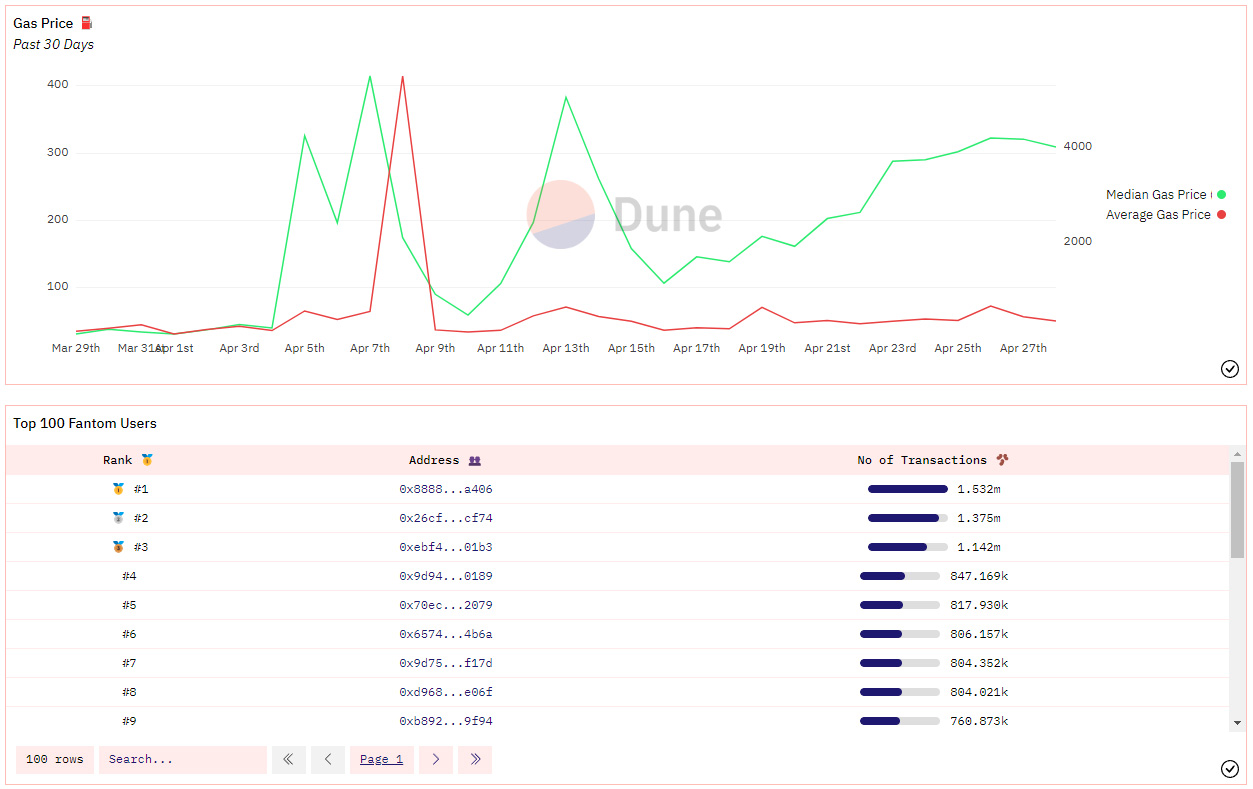
Some dashboard examples on Fantom include the Fantom Ecosystem Overview by Henrystats, the Mummy Finance - Everything Dashboard by Traevon, and the Fantom Blockchain Overview by Sixdegree Lab.
These dashboards offer dozens of insights into the Fantom platform, such as transaction count, active addresses, gas usage, smart contract creation, trading volume, average blocks per minute, and much more. They make it simple for users to discover many aspects of Fantom or for developers to perform market research.
Additionally, the Dune API allows developers to fetch and use the data queried by any dashboard on Dune. As such, developers can save time by leveraging existing queries rather than creating their own.
Nansen
“Nansen is a blockchain analytics platform that enriches on-chain data with millions of wallet labels.”
Nansen is an analytics dashboard that revolves around labeling wallets and contracts. It has over 250 million addresses labeled across multiple chains, allowing users to see the flow of assets across these wallets to discover opportunities and perform due diligence.
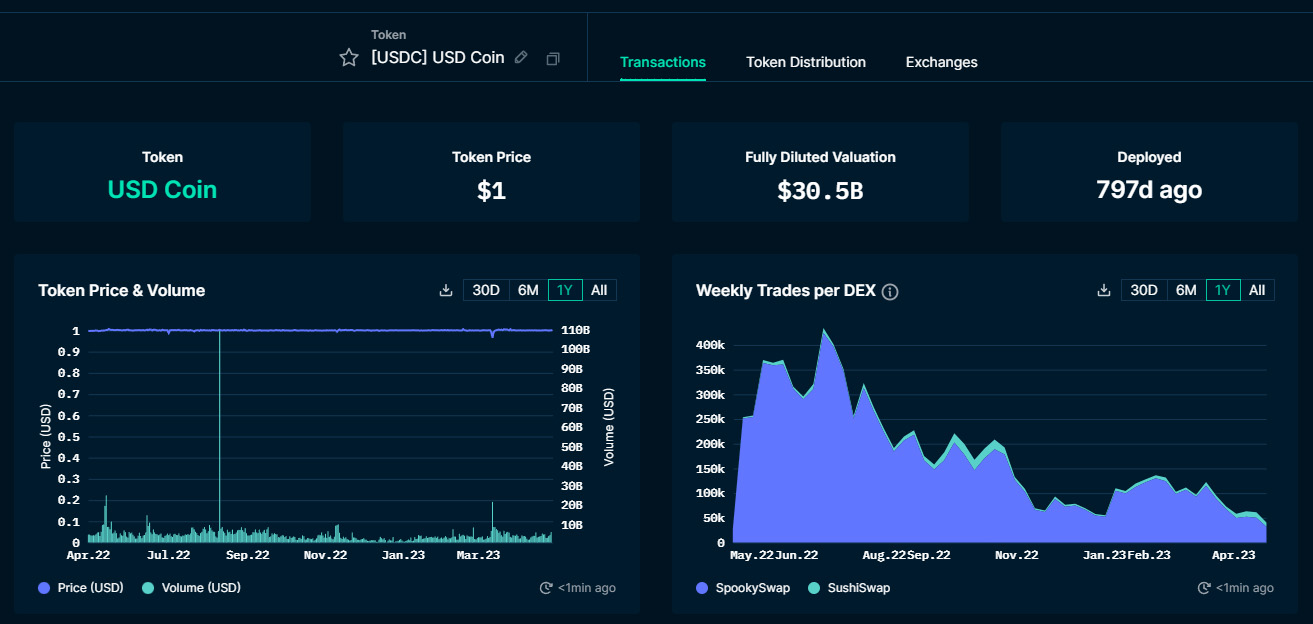
On Fantom, the dashboard’s Wallet Profiler presents data on any address, including its activity, token balances, related wallets, and more. The Token God Mode presents data on any token, including its transactions, distribution, exchange activity, liquidity, and more.
The DeFi Paradise allows users to discover liquidity and staking pools across many DeFi applications. The Hot Contracts shows the most active contracts to allow for early discovery of opportunities. In addition, it is possible to analyze for overlaps or relations between addresses or tokens to form a complete overview of on-chain activity.
Nansen Query is aimed at enterprises and offers programmatic access to blockchain data through custom queries of Nansen data. For example, dApps developers can use this to form a data-driven overview of their project to better understand their users.
Cielo Finance
“Cielo is a custom dashboard for reading on-chain data. It allows you to make sense of the many different transactions a wallet address can generate and to focus on the ones that are of interest.“
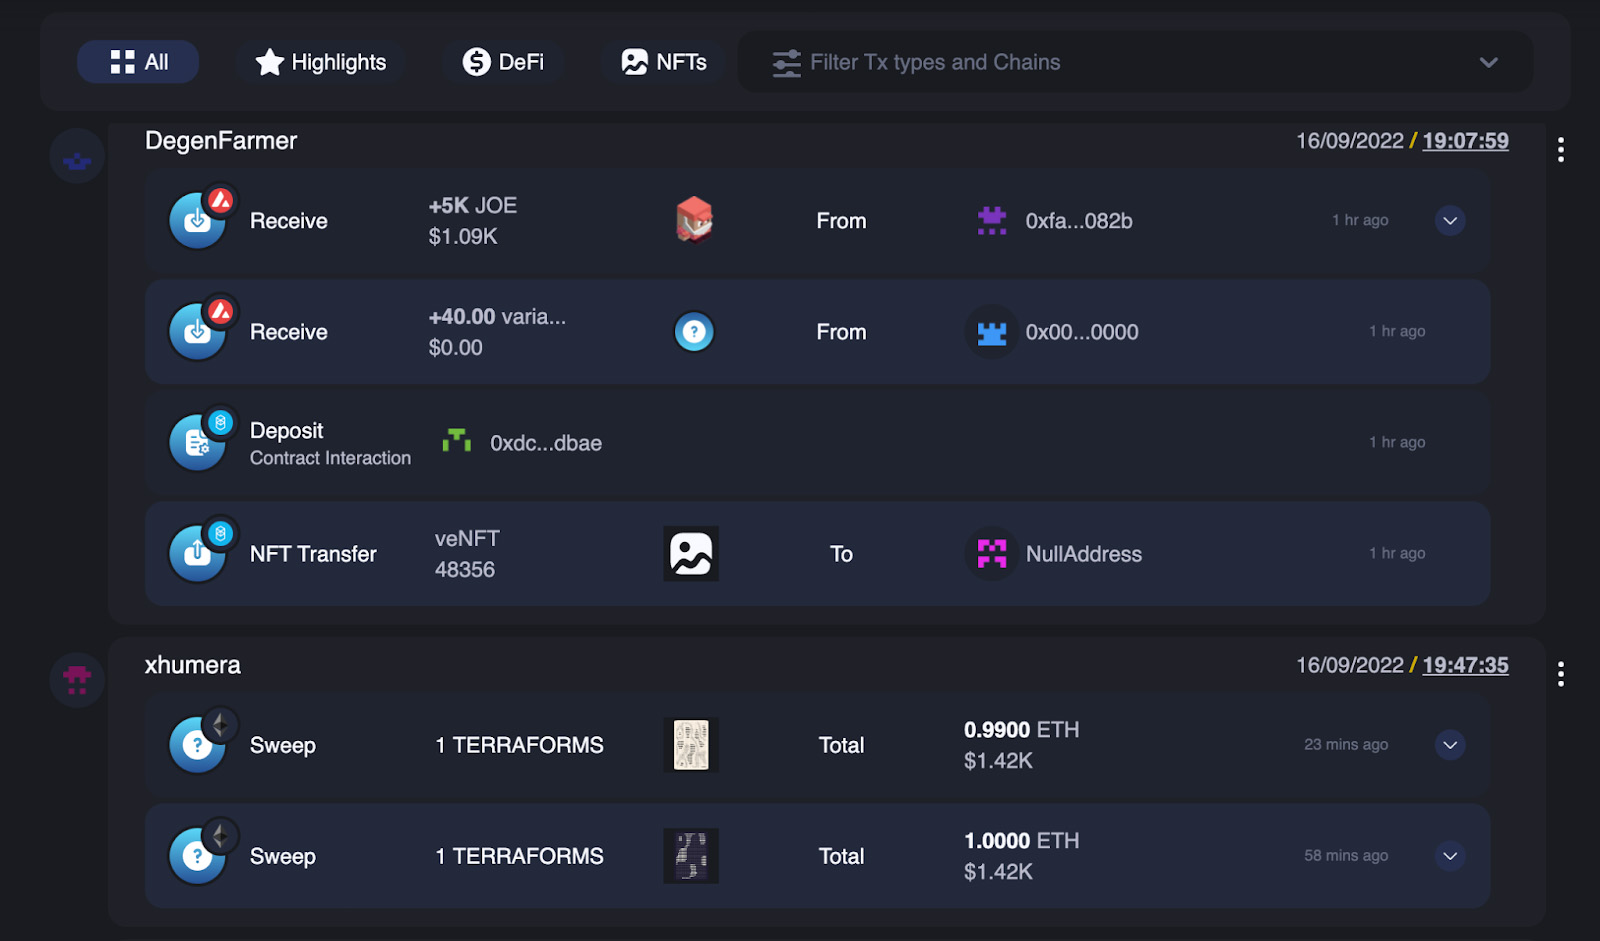
Cielo Finance revolves around a feed that contains a stream of transactions from wallets that the user selects themselves. This wallet-tracking method lessens the chaos experienced by other dashboards and allows the user to focus only on the wallets they choose to track.
The Cielo Feed labels each transaction from the tracked wallets with its date, network, dApp, token amount, and more. By filtering, the feed can be customized to show only certain transactions, such as DeFi or NFT. Users can also click into specific wallets to see their feeds.
Additionally, the NFT section provides an overview of collections and various data on them, such as minters and distribution, and the stats page provides an aggregated view of transaction types from the tracked wallets.
These feeds of data can be added to a Telegram group with the Cielo Wallet Tracker, which sends alerts upon fulfilling preset conditions, such as major token purchases or NFT influencer mints.
CoinBrain
“CoinBrain is the next-gen analytics platform for crypto traders that combines traditional and alternative data to help you to identify the hidden gems on the market.”
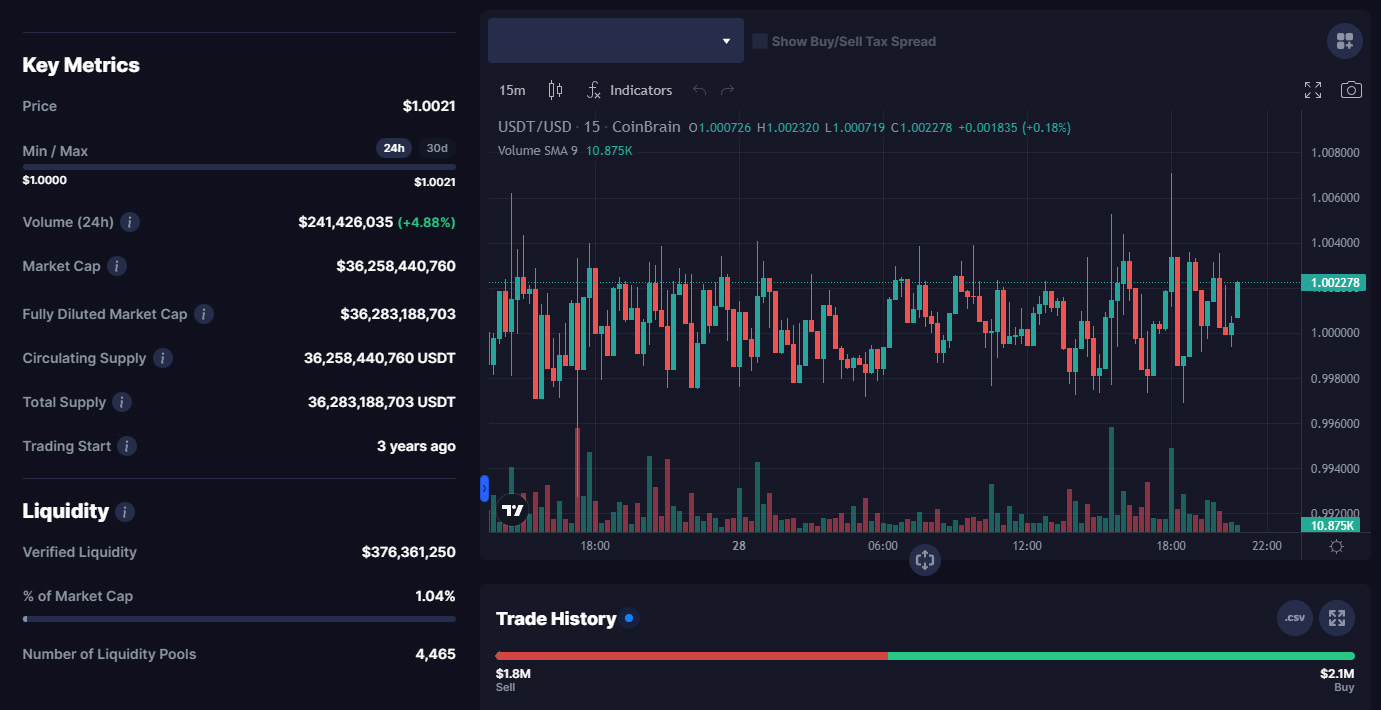
CoinBrain is dedicated to providing a complete overview of tokens along with numerous metrics related to them. On the main page, users can filter tokens by name, chain, price, market cap, volume, liquidity, amount of trades, and age.
With the CoinBrain API, developers can access every piece of token data that CoinBrain offers and integrate them into their dApps. With its price bots, general users can add commands to Telegram and Discord with which they can access token data, such as prices and charts.
Blockpour
“Blockpour aggregates on-chain data from multiple chains, providing insights to help you identify new opportunities and trading strategies.”
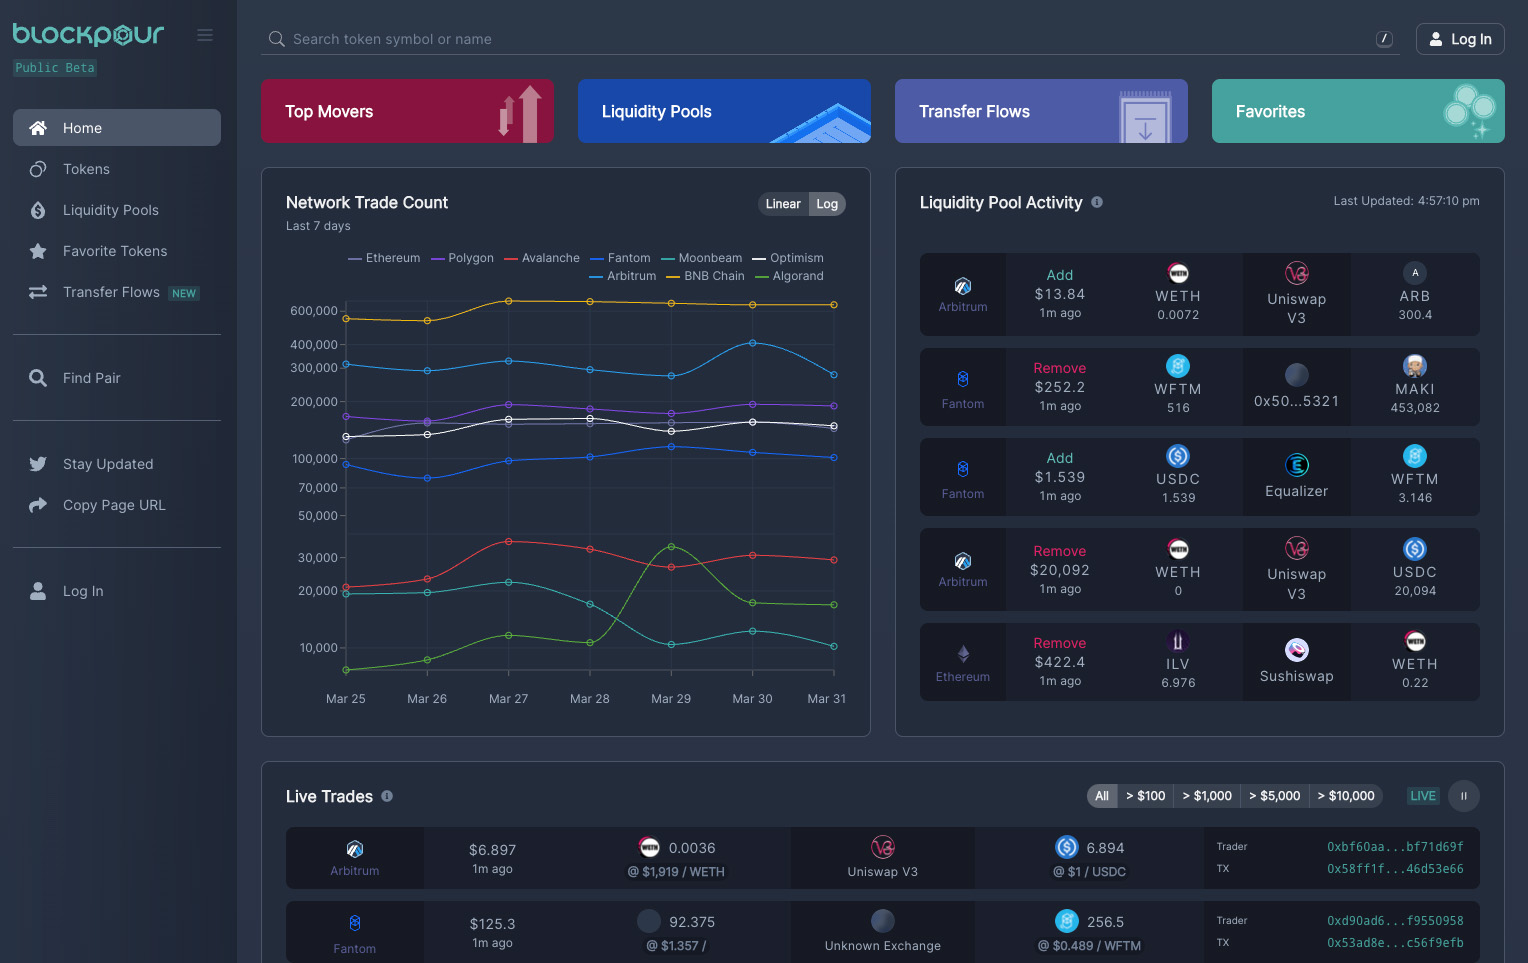
Blockpour is an analytics dashboard that provides an overview of many tokens across multiple chains and their liquidity. Its aim is to enable liquidity analysis, arbitrage opportunities, trade reports, rug pull identification, and more.
On each token page, users can access the token's price action, trading volume, liquidity, and other related metrics. Additionally, the page offers an overview of the liquidity being added or removed from liquidity pools associated with the particular token.
Additionally, the Transfer Flows feature enables the visualization of token inflows and outflows associated with a particular address. This is achieved by drawing lines on a canvas between the transactions displayed in boxes.
The Blockpour API allows developers to access the data available on BlockPour and integrate them into their dApps.